Jul 17, 2023 • 2 min read
Error Monitoring - Auto Resolver, Extension Filtering, and the Instance View
Getting your application’s errors count down is a never ending battle. The enlightened developer would want the equivalent of Inbox Zero for errors but practically that’s a pipe dream. Errors come in at an inconsistent rate and context switching to fix them is a heavy toll. What’s worse is when you spend an exorbitant amount of time on an error to uncover that it’s completely unrelated to your code.
At Highlight, with our commitment to dogfood the product ourselves, we found that our error monitoring made it hard to tame errors on a consistent basis. While we speculated on various reasons why, we landed on one root cause: too much noise and not enough signal.
Today we are launching several new features to help make every developer’s error monitoring experience more delightful and surface only what’s most important.
Auto resolving errors
When we take a sharper lens to individual errors, most of them are not of the “wake up in the middle of the night” flavor. Most of them tend to be a transient blip or a rare bug from an esoteric browser. Software moves quickly and an error that happened once a couple weeks ago isn’t worth spending developer cycles on.
Our new auto resolver feature project setting will automatically resolve errors that haven’t occurred in a given interval.
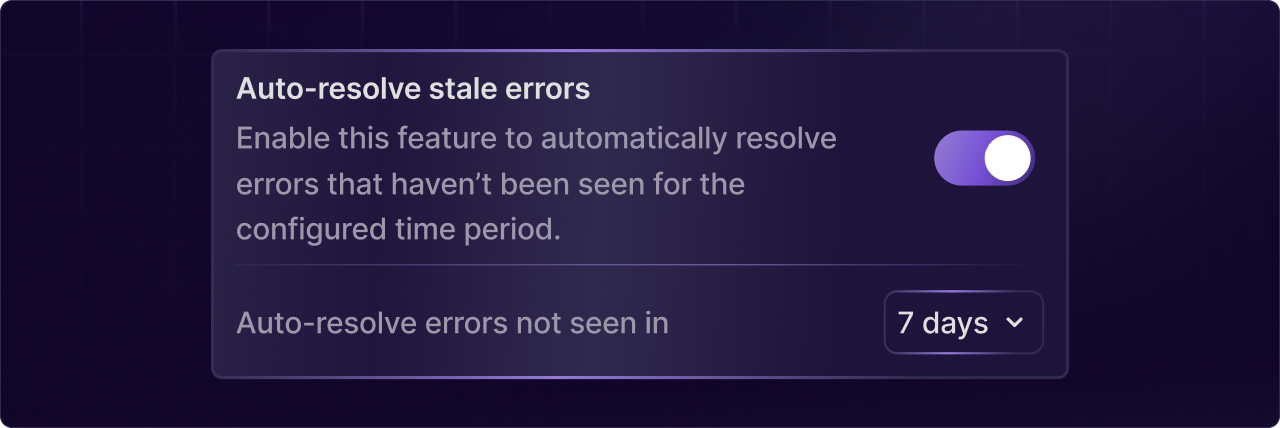
This can dramatically declutter your view and make looking at your product’s errors less overwhelming. At Highlight, we set this to 7 days and have a weekly sync to look at our errors. Before releasing this feature, we’d have hundreds of errors to sift through. Now, when we meet up, there’s a manageable 10-20 for our team to address.
Auto-filtering browser extension errors
Browser extension errors are one of the more frustrating errors to see in Highlight. Because the barrier to entry on writing an extension is low, they tend to leak errors out into your application. Unfortunately, there’s nothing you can do to actually fix this minus contacting the browser extension author. Given this isn’t the best use of your time, we’ve added a project setting feature to filter out extensions that we detect are sourced from browser extensions.
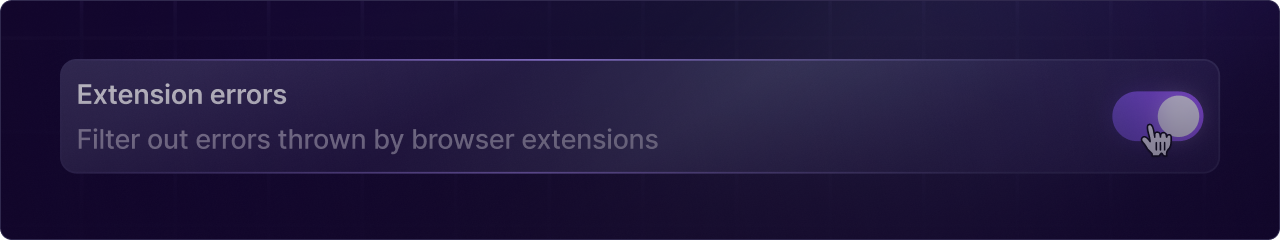
We currently filter out errors from Chrome and Firefox extensions and plan to add support for additional browsers in the future.
Error instances view
Picture this: a customer writes in about an issue they’re facing. They give you reproduction steps, but they don’t work in your testing. You can find the error in Highlight; however, sifting through all the instances of that error to find one particular user feels like a needle-and-haystack situation.
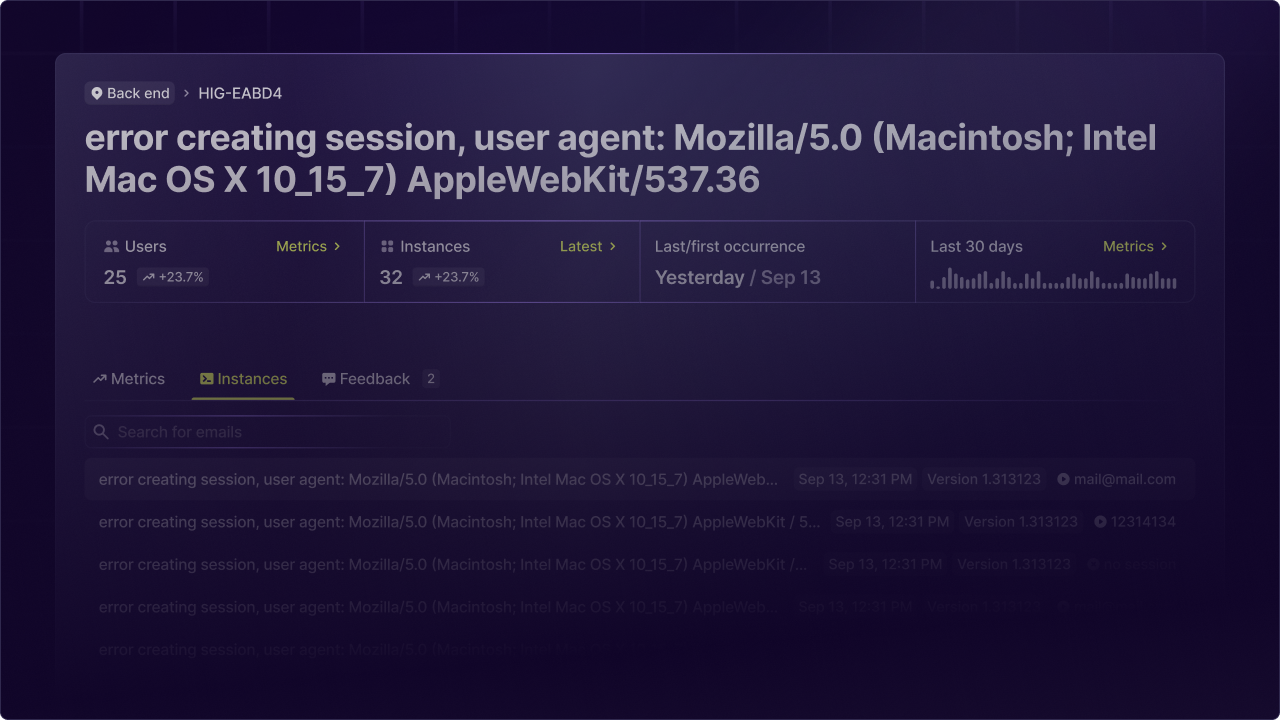
Highlight now provides a more friendly list view so you can easily see all instances of a given error along with the ability to search by a user’s email address. This allows you to find the exact error instance belonging to that user along with their session to see exactly what they did to trigger the bug.
To use this feature, head over to your error feed, click any error, and click the "See all instances" button.
Other articles you may like
Jan 30, 2025 • 4 min. read
Jan 14, 2025 • 18 min. read