Aug 27, 2024 • 5 min read
Monitoring Browser Applications with OpenTelemetry
Many development teams leverage OpenTelemetry (OTeL) on the server side to collect signals such as logs, traces, and metrics from their applications. However, what's often overlooked is the power of OTeL's browser instrumentation. This client-side observability data can provide meaningful insights and create a comprehensive view of an application's performance by connecting traces between the client and server.
What is OpenTelemetry?
OpenTelemetry is a collection of tools, APIs, and SDKs used to instrument, generate, collect, and export telemetry data (metrics, logs, and traces) for analysis in order to understand your software's performance and behavior.
If you're interested in a deeper dive on OTeL, check out our recent article: What is OpenTelemetry and Why Should I Care?.
OpenTelemetry in Browser Applications
When it comes to browser apps, OpenTelemetry can provide valuable insights into:
- Document Load Performance
- User Interactions
- Network Requests (XMLHttpRequest and Fetch)
These insights allow developers to identify bottlenecks, track user interactions, and monitor network requests without manual instrumentation. What's mentioned above is data you get relatively easily by leveraging OTeL's auto instrumentations but you can also add manual instrumentation to collect traces on any other code in you client-side apps.
Highlight and OpenTelemetry
Highlight's JavaScript SDK offers built-in support for collecting OpenTelemetry data from client-side applications. This integration allows you to seamlessly incorporate OpenTelemetry tracing into your web applications.
Highlight automatically collects most of the OpenTelemetry data you'll need by leveraging the auto instrumentations and doing some additional processing to make the data more useful in Highlight. You can disable specific frontend traces by using the otel.instrumentations option as seen below:
H.init({
  // ...
  otel: {
   instrumentations: {
      ['@opentelemetry/instrumentation-user-interaction']: false
   }
  }
})


This will disable any user interaction traces (e.g. mousemove) from being recorded. The list of default instrumentations are:
- '@opentelemetry/instrumentation-document-load'
- '@opentelemetry/instrumentation-fetch'
- '@opentelemetry/instrumentation-xml-http-request'
- '@opentelemetry/instrumentation-user-interaction'
Connecting Client and Server Traces
One of the most powerful features of OpenTelemetry is the ability to connect traces across different services and environments. Highlight's SDKs facilitate this through context propagation, allowing you to create end-to-end traces that span from user interactions in the browser all the way to your backend services.
Here's how it works:
- Trace Initiation: When a user interaction or a network request is initiated in the browser, the SDK creates a new span or continues an existing trace.
- Header Injection: For outgoing HTTP requests (both XHR and Fetch), the SDK automatically injects trace context headers into the request. These headers typically include:
traceparent: Contains the trace ID, parent span ID, and trace flags.tracestate: Carries vendor-specific trace information.
- Server-Side Reception: The Highlight server-side SDKs extract these headers and continue the trace, linking the server-side spans to the client-side trace.
- Trace Completion: As the request completes and returns to the client, the full trace, including both client and server spans, can be visualized in Highlight's UI.
This connection between client and server traces provides end-to-end visibility and is the link required necessary for page speed insights and client/server error correlation.
For server-side rendering where code executes on the server before HTML is sent to the browser, the trace context is propagated through a <meta> tag that is added to the HTML.
Example Client-Server Trace Lifecycle
Here's a simplified example of how this works in practice:
- A user clicks a button in your web application.
- The Highlight SDK creates a span for this user interaction.
- This interaction triggers an API call to your backend.
- The SDK automatically injects trace headers into this API call.
- Your backend receives the request, extracts the trace context, and continues the trace.
- The backend processes the request and sends a response.
- The client receives the response and completes the span.
The result is a single trace that shows the complete journey of the request, from the initial user interaction in the browser, through your backend services, and back to the client.
Benefits
This connection between client and server traces provides several benefits:
- End-to-End Visibility: You can trace a user's action all the way through your system, making it easier to diagnose issues and understand performance bottlenecks.
- Performance Optimization: By seeing the complete picture, you can identify whether performance issues are occurring on the client-side, server-side, or in the network communication between them.
- Error Correlation: If an error occurs, you can see the full context of what led to that error, including any relevant client-side actions or server-side processing.
By leveraging Highlight's OpenTelemetry integration, you can gain these insights with minimal configuration, allowing you to focus on improving your application's performance and user experience.
Handling Server-Initiated Traces
When a request for a page is made by fetching a new URL in the browser we don't have the JS SDK initialized in the browser until the server returns the HTML and renders the page, then fetches all the JS assets to render the app. In this case you pass the trace ID from the server to the client in a <meta> tag to handoff the trace initiated on the server to the client.
Here is an example of what the meta tag looks like in the browser:
<meta
  name="traceparent"
  content="00-ab42124a3c573678d4d8b21ba52df3bf-d21f7bc17caa5aba-01"
>
Note that the Highlight server SDKs often have helpers to create this tag. Here's an example using the Highlight Ruby SDK
<%= highlight_traceparent_meta %>
The browser OTeL instrumentation gathers timing information from window.performance.timing and creates spans for all the different timing events in the browser. This instrumentation parses the <meta> tag and associates all the spans it creates with trace data from the tag. This is illustrated in the screenshot of the flame graph below.
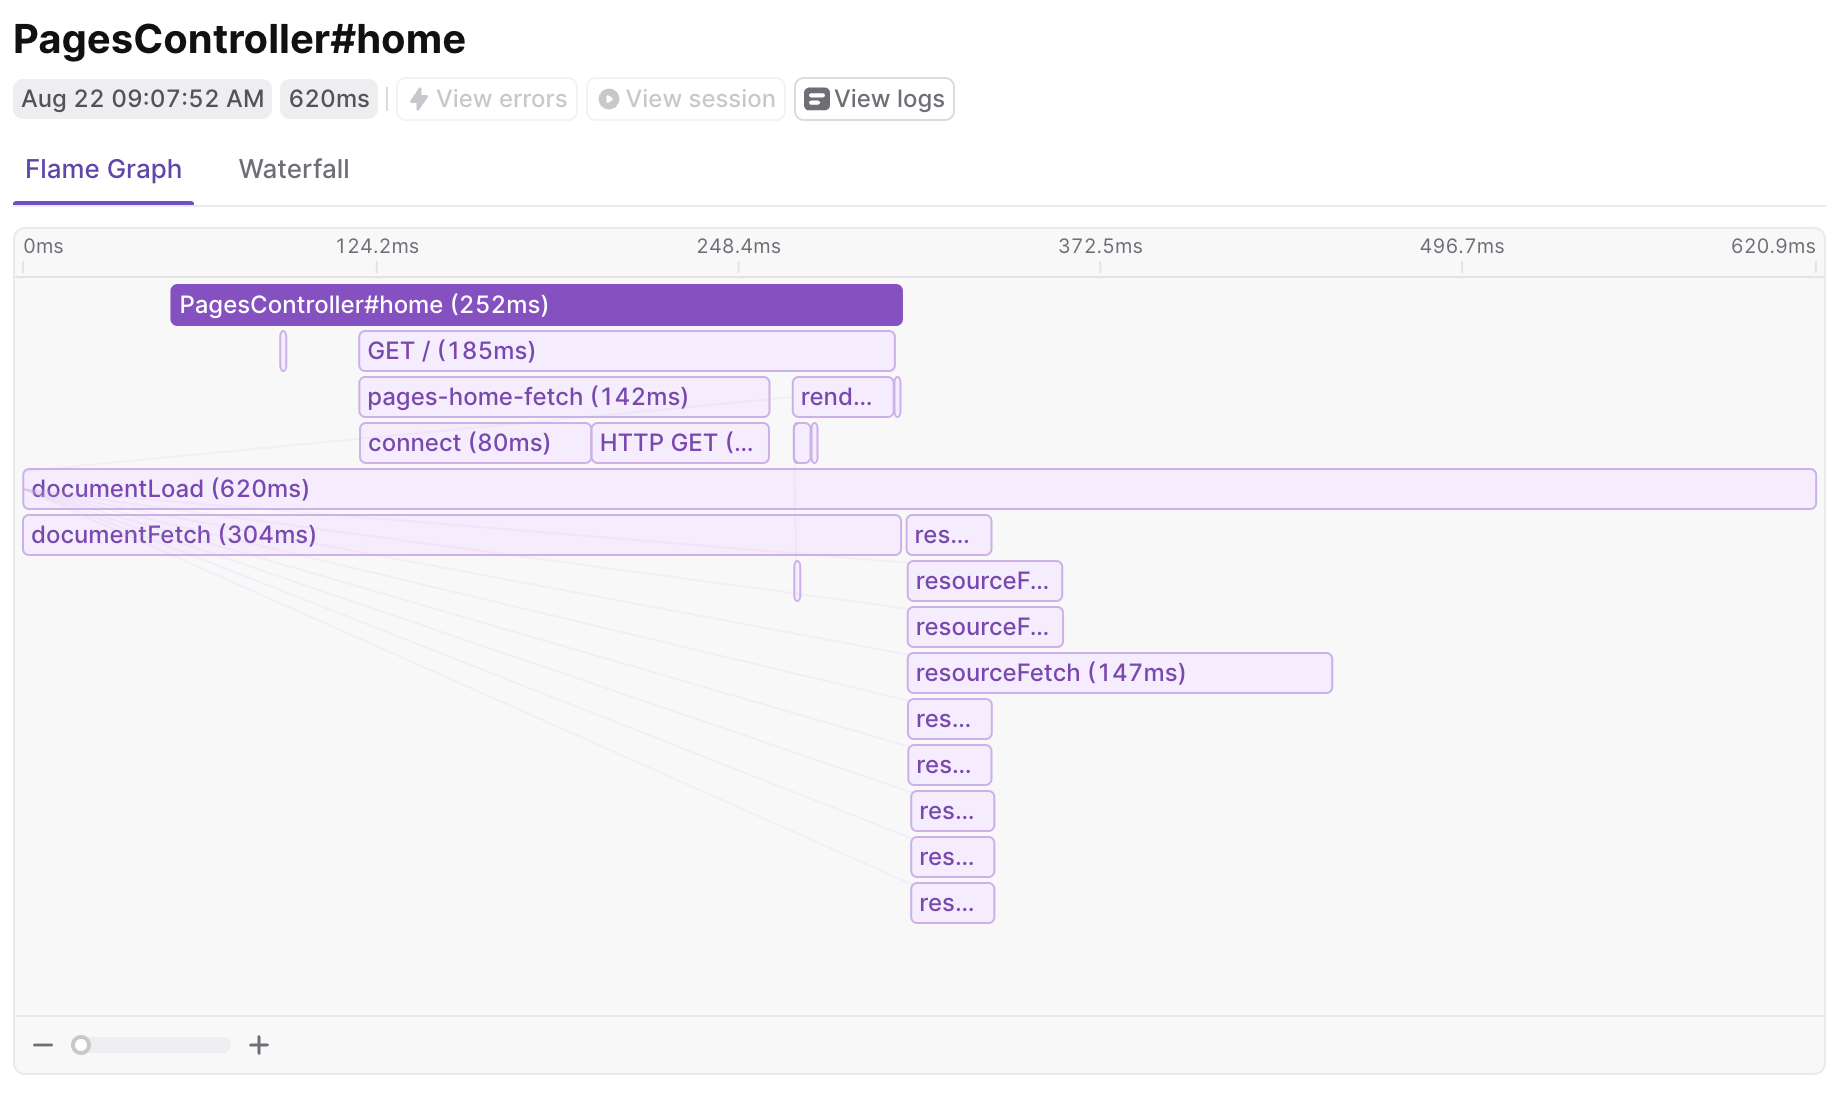
Here's how to parse what's going on in this flame graph:
- The
documentLoadspan shows the full timing from submitting the URL in the browser to be loaded to having all the assets loaded and the page being fully interactive. The timing data for this span is gathered fromwindow.performance.timingsince we can't actually initiate a span before the JS loads. - The
PagesController#homeis the first span created on the server. You can trace the server code execution required to render the HTML that will be returned to the browser. When the HTML is returned to the browser thedocumentFetchspan finishes. - After the HTML is loaded int he browser you can see the requests for the page's resources (all the JS and CSS files), these are the
resourceFetchspans.
These resource timings provide a full picture of your app's load time, making it clear where the opportunities are to improve performance and provide a better UX.
Leveraging OpenTelemetry Data in Highlight
Collecting OpenTelemetry data is one thing, but gleaning actionable insights is another. You need some way of visualizing the data (like the flame graph shown above) in order to get actionable insights. Highlight exposes this data a few ways.
Viewing Traces in Highlight
When you open Highlight's UI, you'll find a dedicated section for traces. Here, you can see a list of all the traces collected from your application, including those that span from the browser to your backend services.
-
Trace List: This view provides an overview of all traces, typically sorted by timestamp. You can filter and search for specific traces based on various criteria such as duration, error status, or custom attributes.
-
Trace Detail View: Clicking on a specific trace opens a detailed view, showing the full journey of a request or user interaction. This view includes:
- A flame graph visualization of the trace, showing the hierarchy and timing of spans.
- Detailed information about each span, including start time, duration, and any custom attributes or events.
- For spans representing network requests, you can see details like HTTP method, status code, and headers.
-
Cross-Service Tracing: For traces that span from the browser to your backend services, you'll see a seamless view of the entire request lifecycle. This makes it easy to identify whether performance issues are occurring on the client-side, server-side, or in the network communication between them.
Analyzing Resource Timings and Web Vitals
Highlight's metrics product provides powerful tools for analyzing resource timings and Web Vitals, which are crucial for understanding and optimizing your application's performance.
-
Resource Timing Dashboard: This dashboard provides an overview of how long it takes to load various resources on your web pages. You can see:
- Load times for different types of resources (JS, CSS, images, etc.)
- Time spent on DNS lookup, TCP connection, TLS negotiation, and more for each resource
- Visualizations that help identify slow-loading resources or bottlenecks in the loading process
-
Web Vitals Metrics: Highlight tracks and displays key Web Vitals metrics, including:
- Largest Contentful Paint (LCP): Measures loading performance
- First Input Delay (FID): Measures interactivity
- Cumulative Layout Shift (CLS): Measures visual stability
- First Contentful Paint (FCP): Measures the time from navigation to when the browser renders the first bit of content
-
Performance Trends: Highlight allows you to track these metrics over time, helping you identify:
- The impact of code changes or deployments on performance
- Gradual degradations that might otherwise go unnoticed
- Improvements resulting from optimization efforts
-
Segmentation and Filtering: You can segment and filter these metrics based on various factors such as:
- Device type (mobile, desktop, tablet)
- Browser
- Geographic location
- Custom attributes you've defined
By combining the detailed trace data with these high-level performance metrics, you can get a comprehensive view of your application's performance. This allows you to quickly identify issues, understand their root causes, and measure the impact of your optimization efforts.
Conclusion
OpenTelemetry offers powerful tools for monitoring and optimizing browser applications. By leveraging Highlight's OpenTelemetry integration, developers can glean actionable insights with minimal configuration.
Whether you're dealing with client-side performance issues, server-side bottlenecks, or complex user journeys spanning multiple services, OpenTelemetry and Highlight provide the visibility you need to deliver exceptional web applications.
Other articles you may like
Oct 17, 2023 • 4 min. read
Aug 19, 2022 • 8 min. read