Oct 17, 2023 • 3 min read
Tracing in Beta: Another Layer of Visibility in Your Applications

Back in April we launched Logging built on top of OpenTelemetry and Clickhouse. This was a first step in leveraging telemetry data in Highlight that has proven to provide meaningful insights to our team and our customers. However, OpenTelemetry does more than just logging, it also provides traces and metrics.
Today we’re excited to bring another key piece of telemetry data into Highlight with our new Tracing product. Tracing provides another layer of insights into how your applications are performing with detailed code execution data integrated with session replay, errors, and logs.
How It Works
We add instrumentation around key code execution paths. Some of this instrumentation must be done manually, but we will also integrate with popular frameworks to help you get detailed trace information with minimal effort.
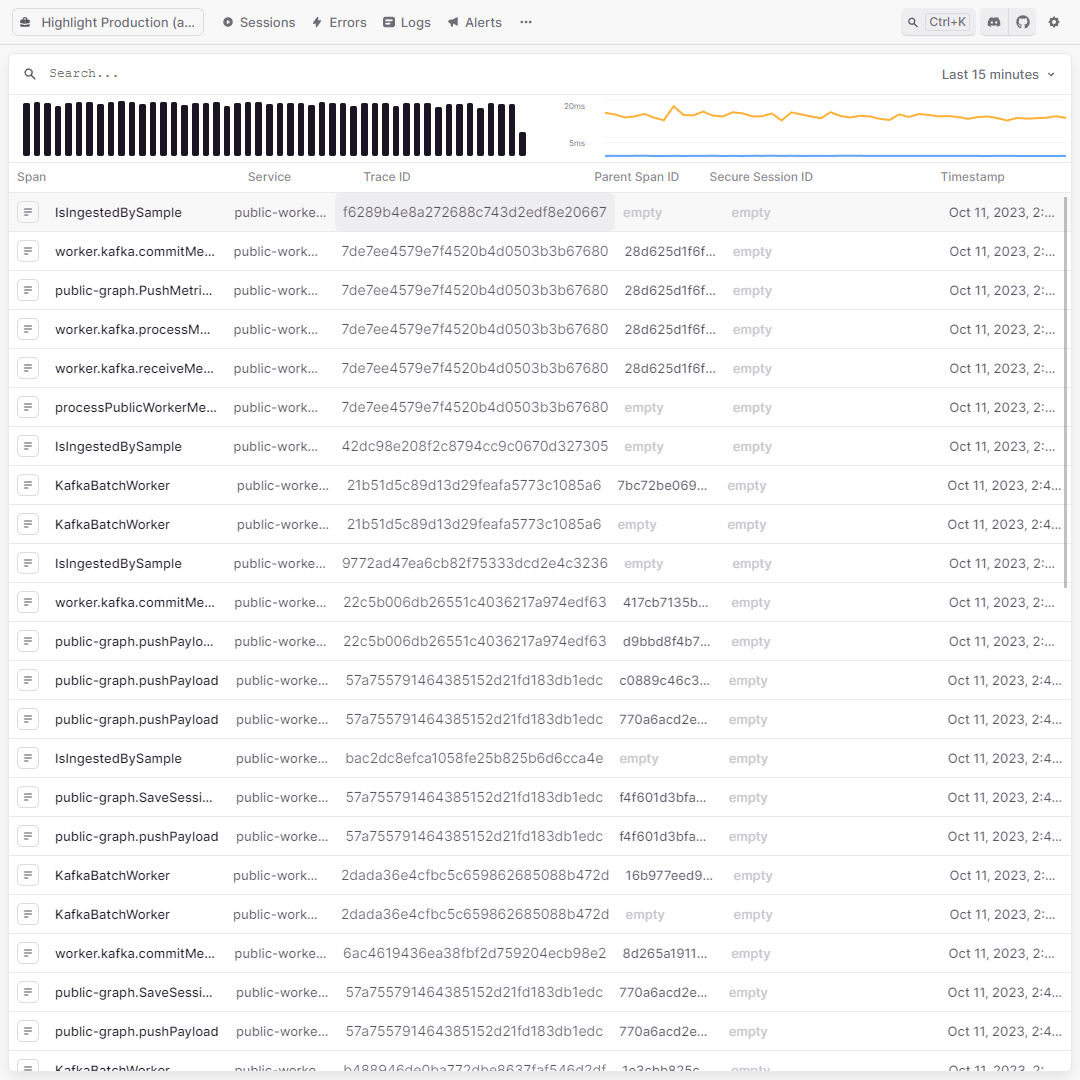
Once the data is collected we expose it contextually (e.g. on a network request to see what it triggered on the server) and in a new traces search, similar to what we have for logs.
Why It Matters
Digging into trace details in Highlight can help you identify hot spots in your codebase where you run into errors or performance bottlenecks. For example, you could analyze a trace for one of your API handlers to get a breakdown of the all methods called, the arguments passed to them, how long execution took for each method, and any errors associated with a method call. By understanding these performance characteristics of your application you can make data-driven decisions to focus your effort to improve performance and enhance your UX.
Get Started
Visit our documentation for details on how to get started with Tracing in Highlight and please reach out if you have any questions! All feedback is welcome and appreciated as we work on refining tracing to make it generally available.
What About Metrics?
We mentioned earlier that OpenTelemtry supports logs, traces, and metrics - so what about metrics in Highlight? Stay tuned for more... until then, happy tracing!
Other articles you may like
Jan 23, 2025 • 14 min. read